Home

Federal IT Intelligence Platform

Know who’s buying what, from whom, before they do.

Two capabilities, one platform. Explore $492B+ in federal IT transactions yourself, then turn what you find into analyst-grade intelligence reports that win deals.

Splunk × USDA — Installed Base
Wolftek Mission Group$22.1M
CPOC Ecosystem$71M
$33.5M Splunk installed · 7 bureaus green space · $4.1B addressable
Splunk × USDA — Growth Plays
Defend CPOC Enterprise$22.1M → $30M+
Capture Forest Service$1–3M
8 prioritized plays · Defend / Grow / Conquer · Sized in dollars
$492B+
Federal IT Spend Analyzed
1.3M+
Transactions Analyzed
7 FY
FY2020 – FY2026
286
Columns Per Award
Two capabilities. One platform.
Explore the data, then turn it into strategy.
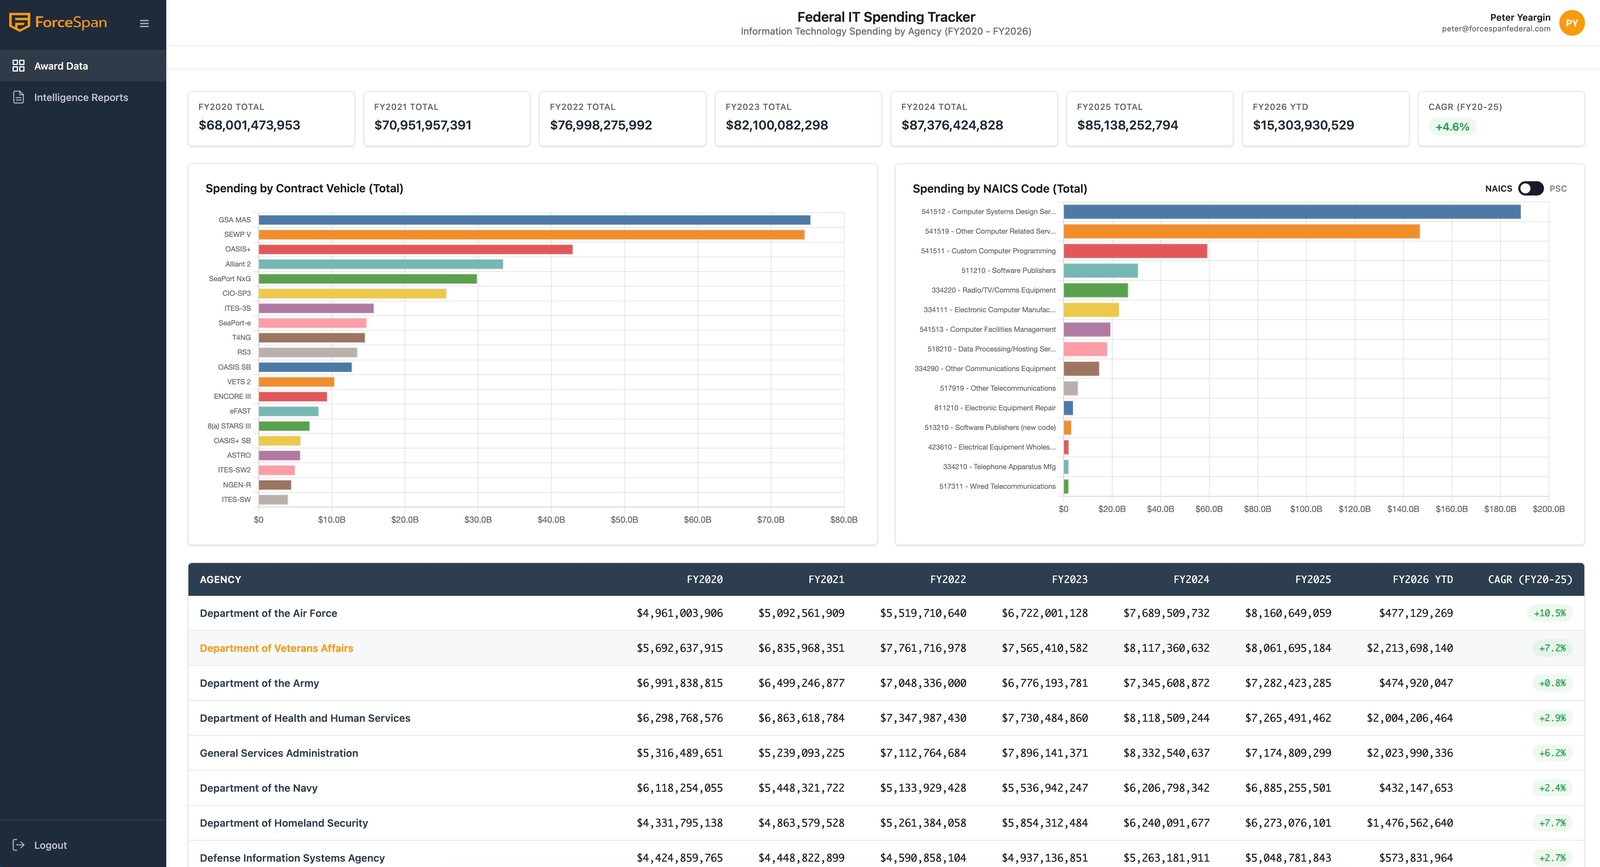
Most federal IT intelligence tools force a choice: dashboards you have to interpret yourself, or static reports that go stale the day they’re delivered. FedSpend gives you both — a live exploration platform, and the analyst layer that turns what you find into account-level strategy.
01
Self-Serve

Award Data Platform

Search, filter, and explore every federal IT transaction. By agency, reseller, contract vehicle, NAICS, and PSC — down to the transaction.

  • Spending dashboards by agency, reseller, and contract vehicle
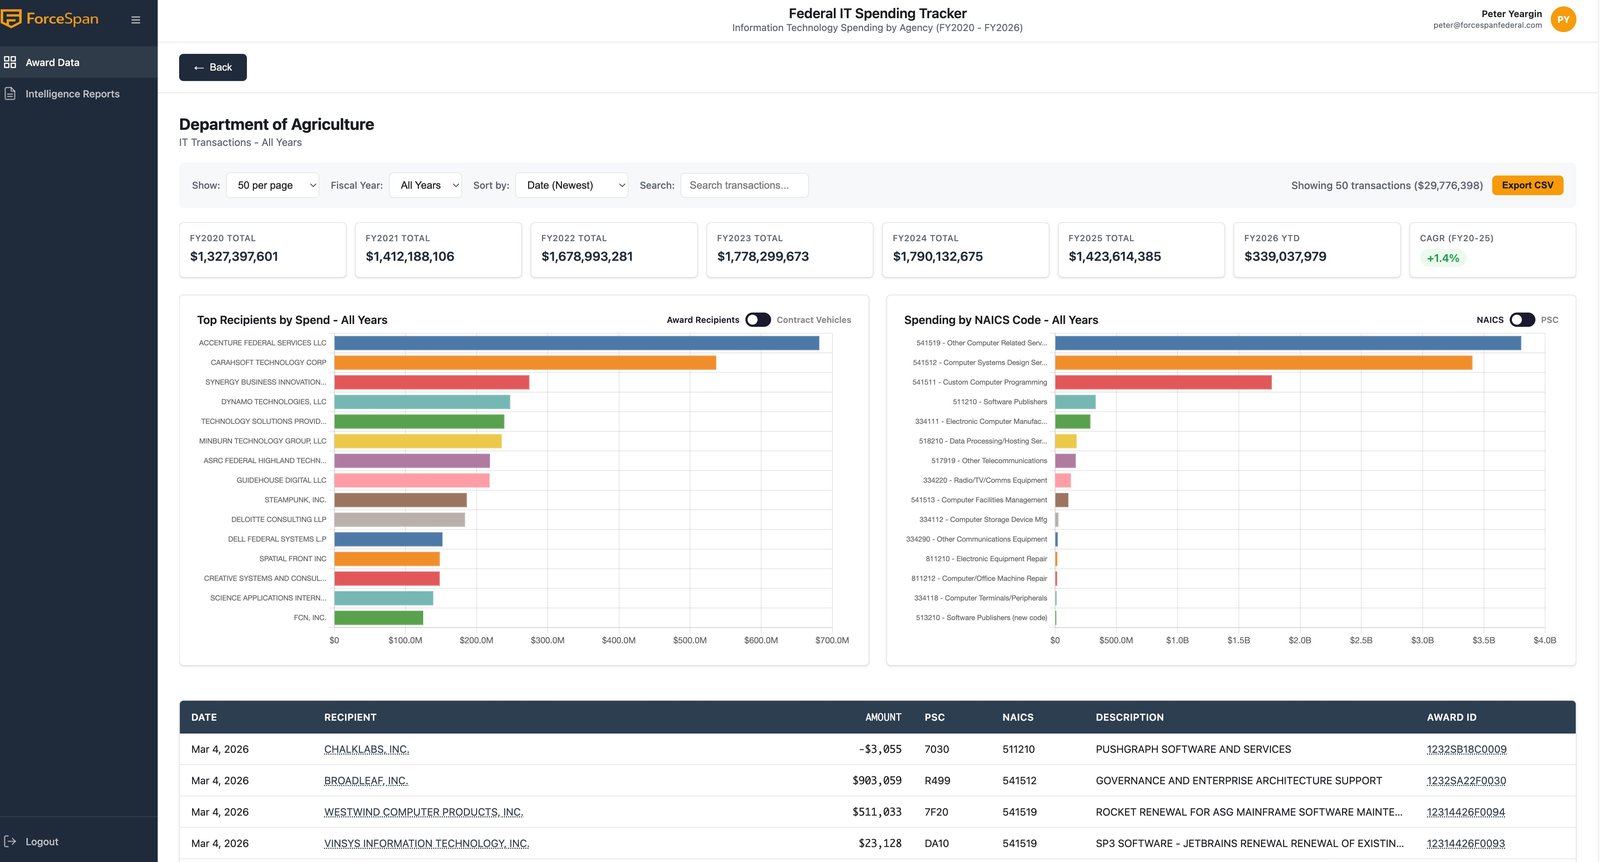
  • Drill from agency totals into bureau, contract, and transaction
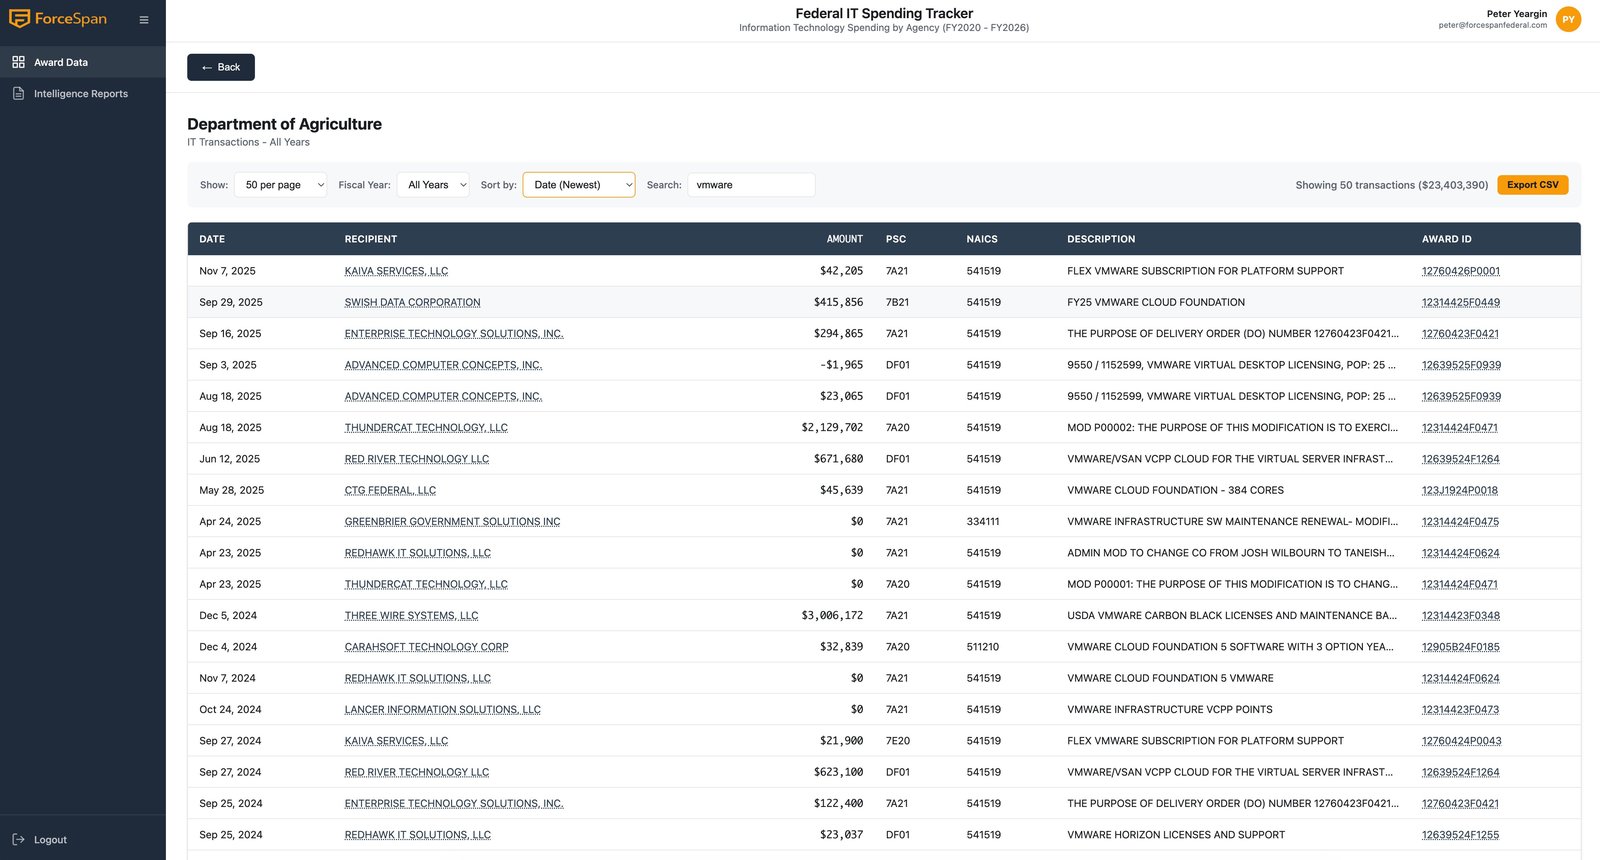
  • Free-text search across 1.3M+ award descriptions
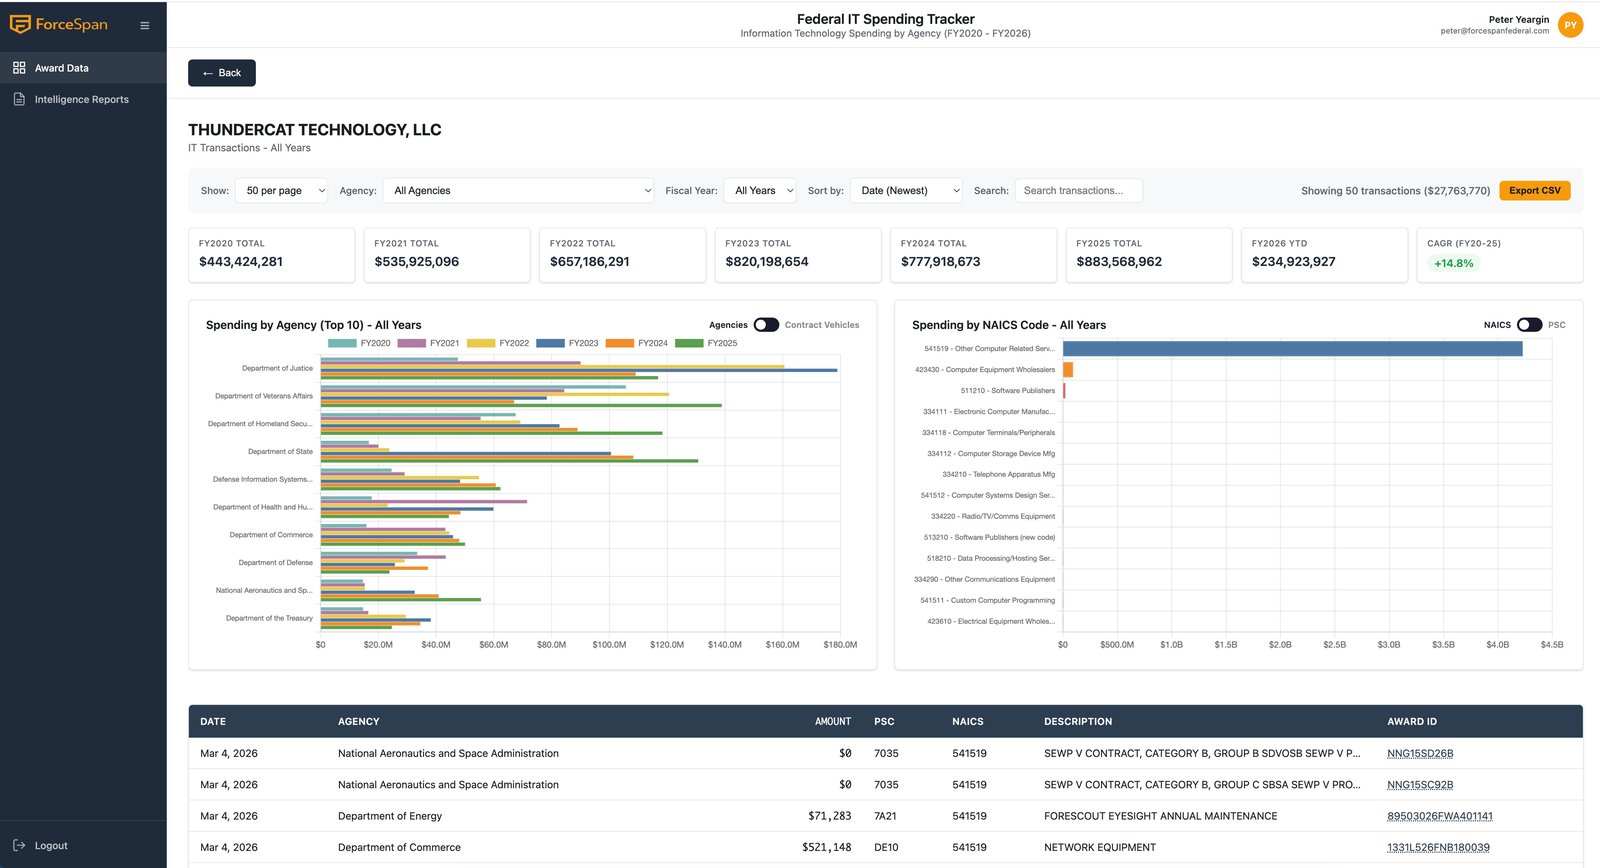
  • Full transaction detail with period of performance, set-aside, competition
  • One-click CSV export for any view
02
Strategy-Ready

Intelligence Reports

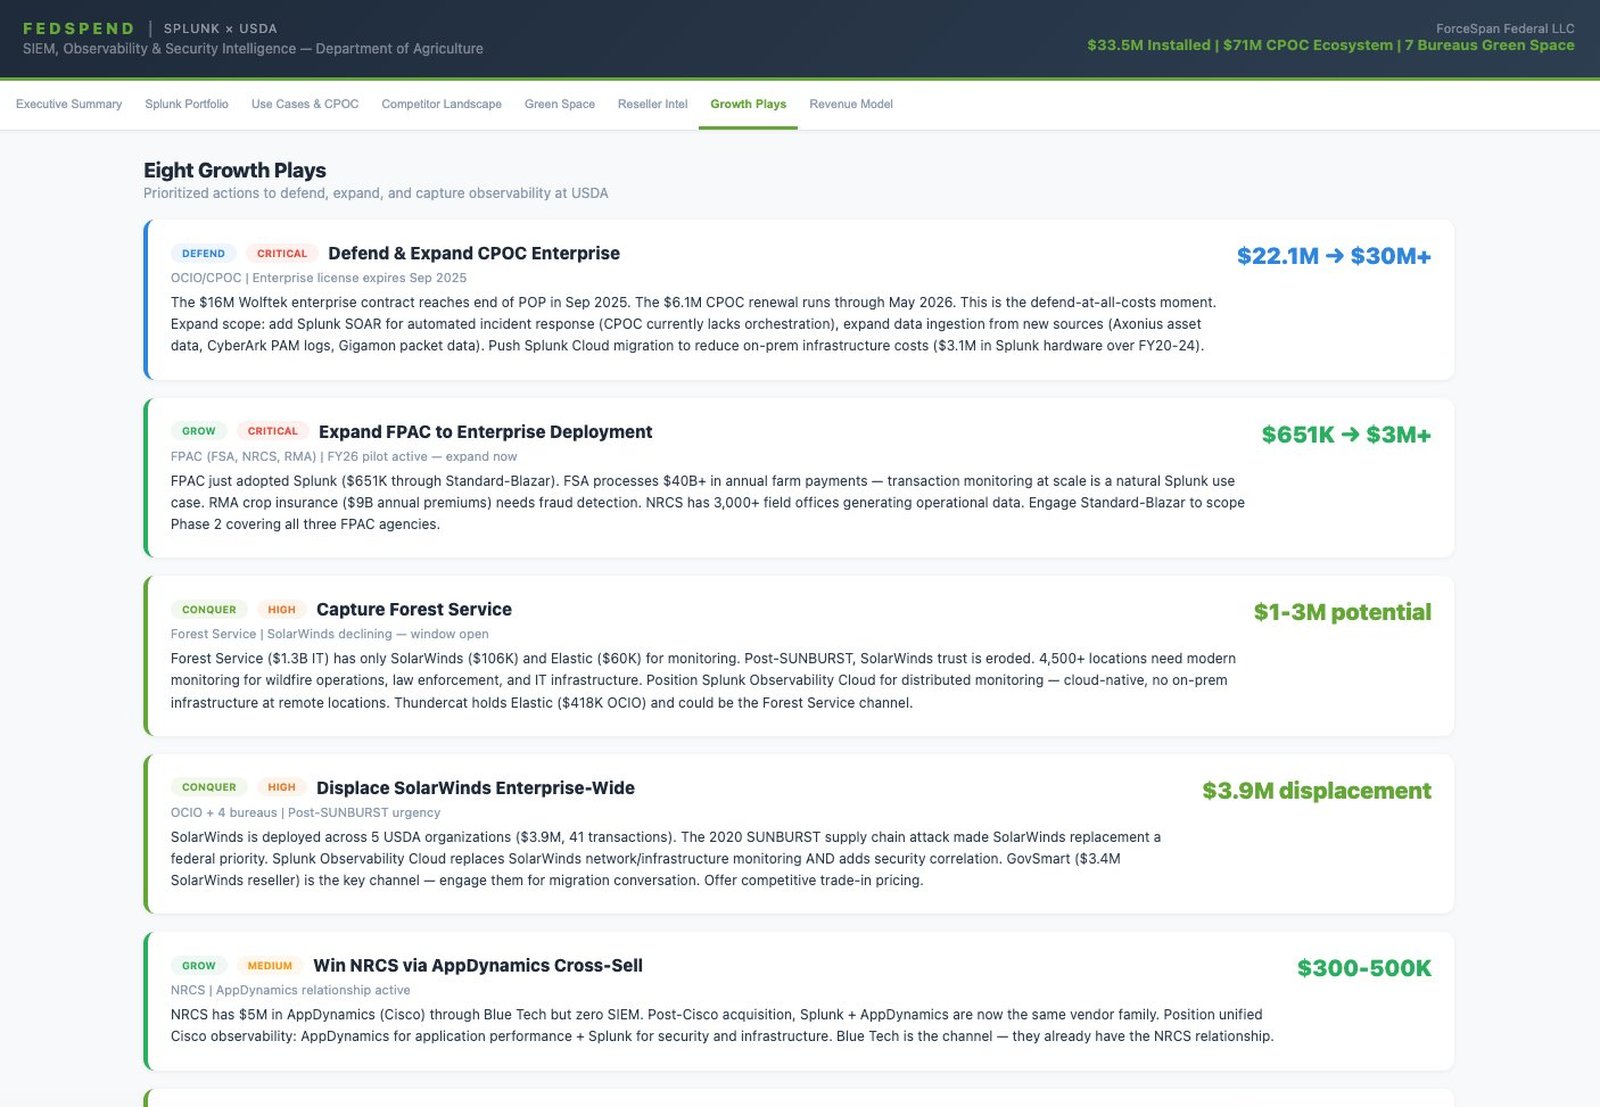
Curated reports built on top of that same data — installed base, competitor maps, expiring contract pipelines, and growth playbooks for specific vendor × agency pairs.

  • Bureau-level installed base with sub-office granularity
  • Competitor spend, reseller maps, and FY trend analysis
  • Expiring contract pipeline with urgency ranking
  • Green space identification and addressable revenue sizing
  • Interactive React dashboards with executive summaries
From $492B in spend to a single transaction — in four clicks.
FedSpend turns USAspending.gov, SAM.gov, SEWP, and FPDS into one cohesive workspace. Every screen below is the live product.
01
Federal IT Spending Overview

Start with $492B in federal IT spend.

FY2020 through FY2026 YTD. Spending by contract vehicle, NAICS, and agency — the full picture before you drill in.

FedSpend platform showing federal IT spend totals by fiscal year and contract vehicle
02
Agency Drill-Down

Drill into any agency.

Department of Agriculture broken out by top recipients, NAICS code, and fiscal year — with full transaction detail one click away.

Department of Agriculture drill-down showing top recipients and spending by NAICS code
03
Vendor & Reseller View

Or any vendor, OEM, or reseller.

See where Thundercat — or any partner — sells, by agency and fiscal year. Channel intelligence at a glance.

Thundercat Technology vendor view showing agency-level spend across multiple fiscal years
04
Free-Text Search

Search to the transaction level.

“VMware” across USDA returns every relevant award — recipient, amount, PSC, NAICS, description, and Award ID. Export to CSV in one click.

Transaction search results showing VMware-related awards across the Department of Agriculture
05
Award Detail

Every transaction, fully decomposed.

Financial summary, recipient, awarding agency, period of performance, classification, competition, and set-aside — sourced from USAspending.gov for every award.

Award detail modal showing full financial, recipient, and classification data for a single VMware purchase order
Two report families. One enriched data spine.
Public spending data tells you what was bought. Our reports tell you who you’re really competing against, when contracts expire, and where to target next — by enriching USAspending with sub-bureau end-user attribution, contract-base intelligence, and AI correlation across SAM.gov, SEWP, and FPDS.
General Reports

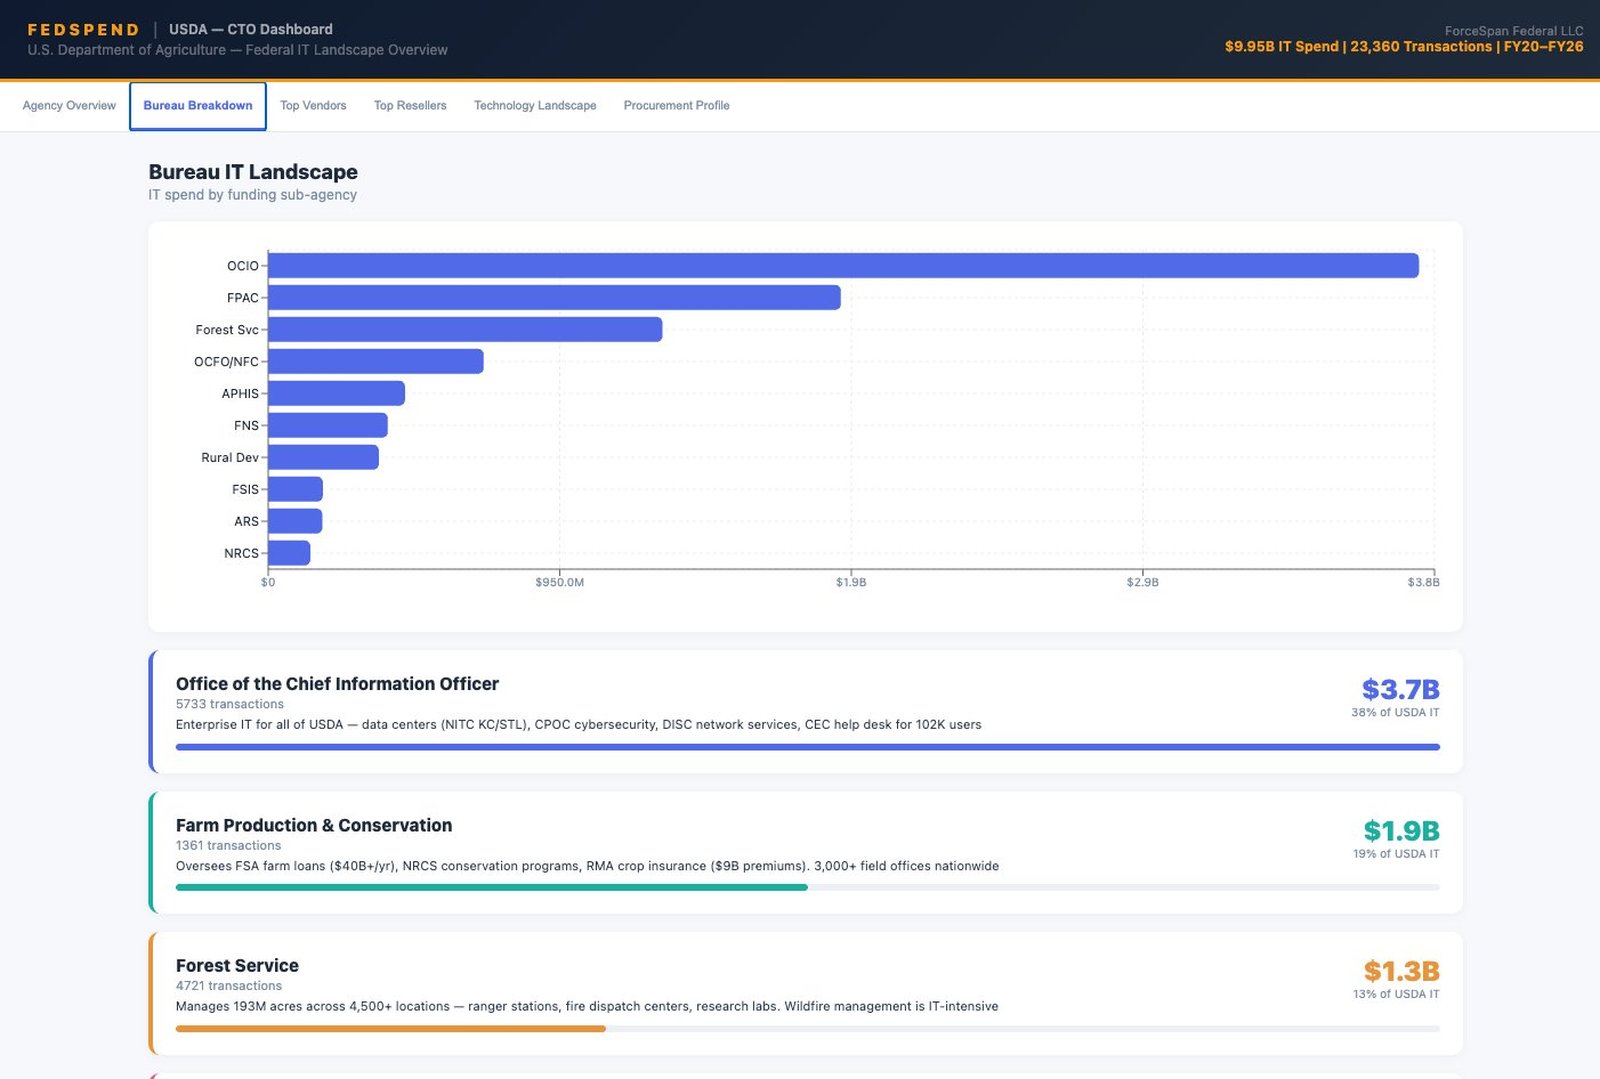
The agency landscape.

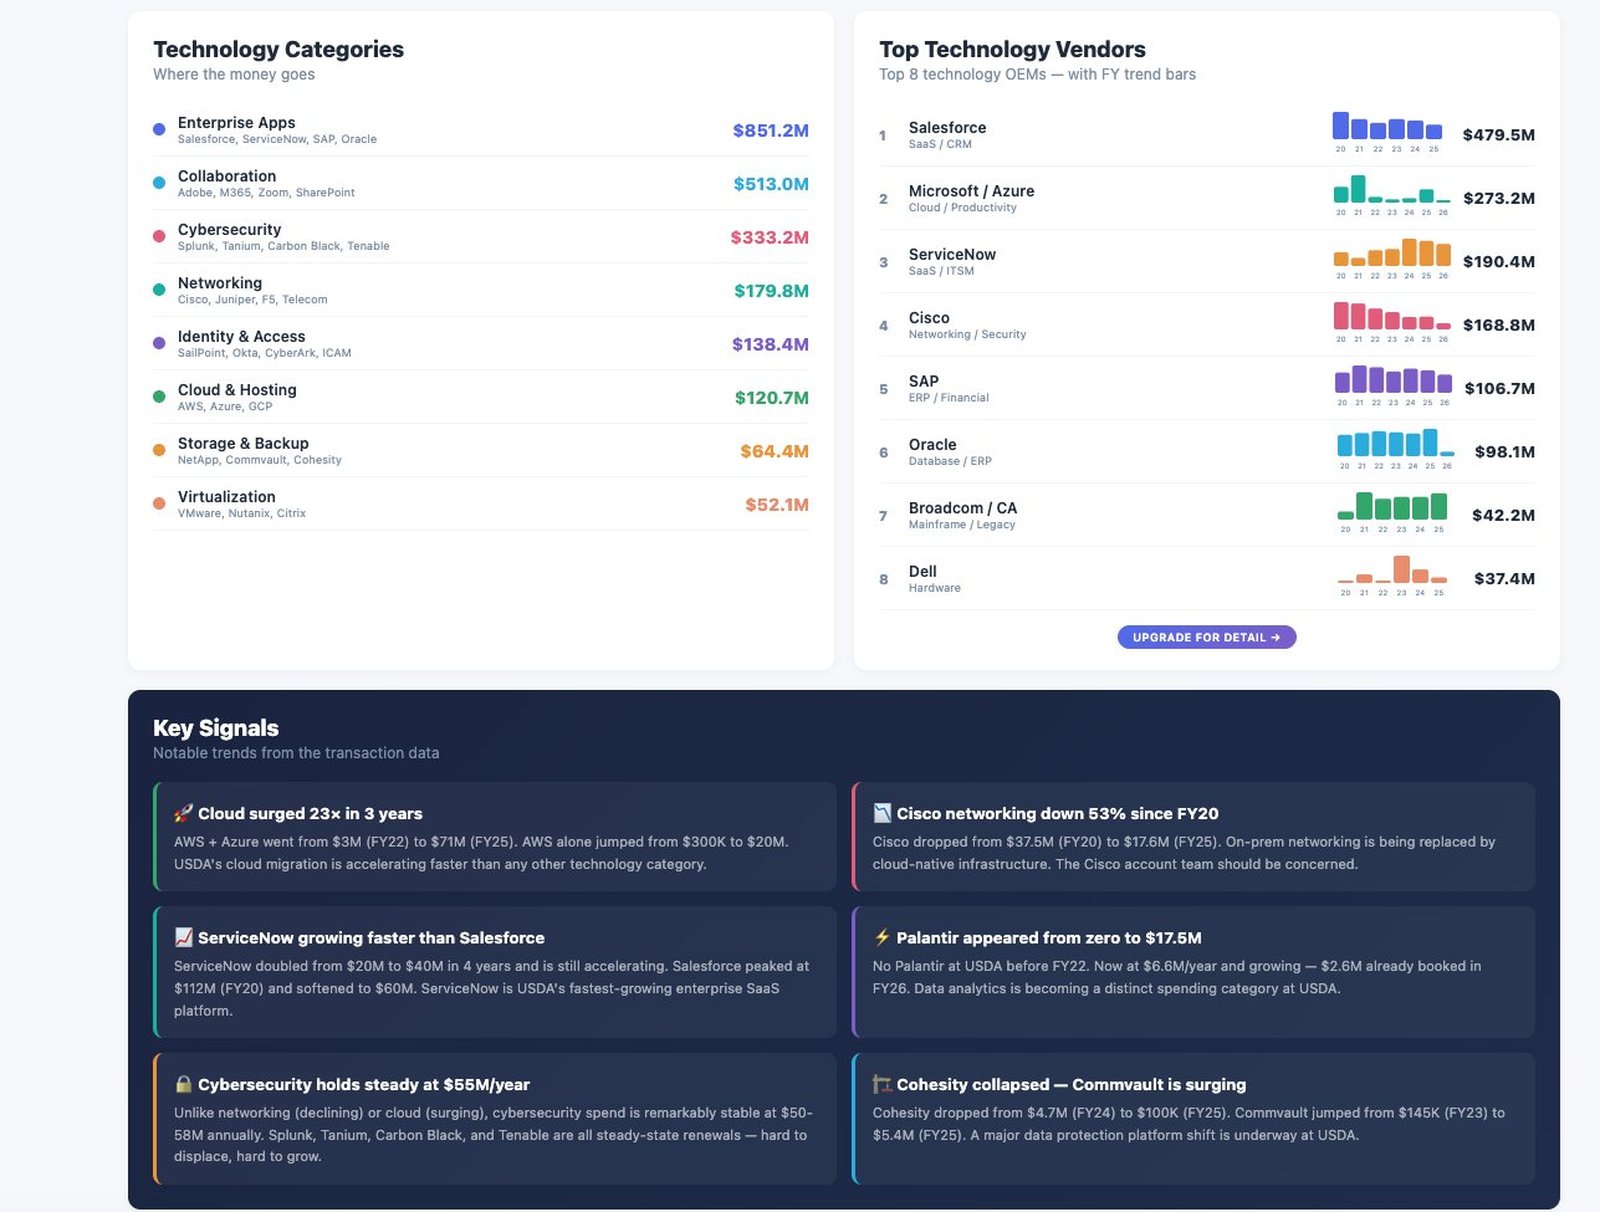
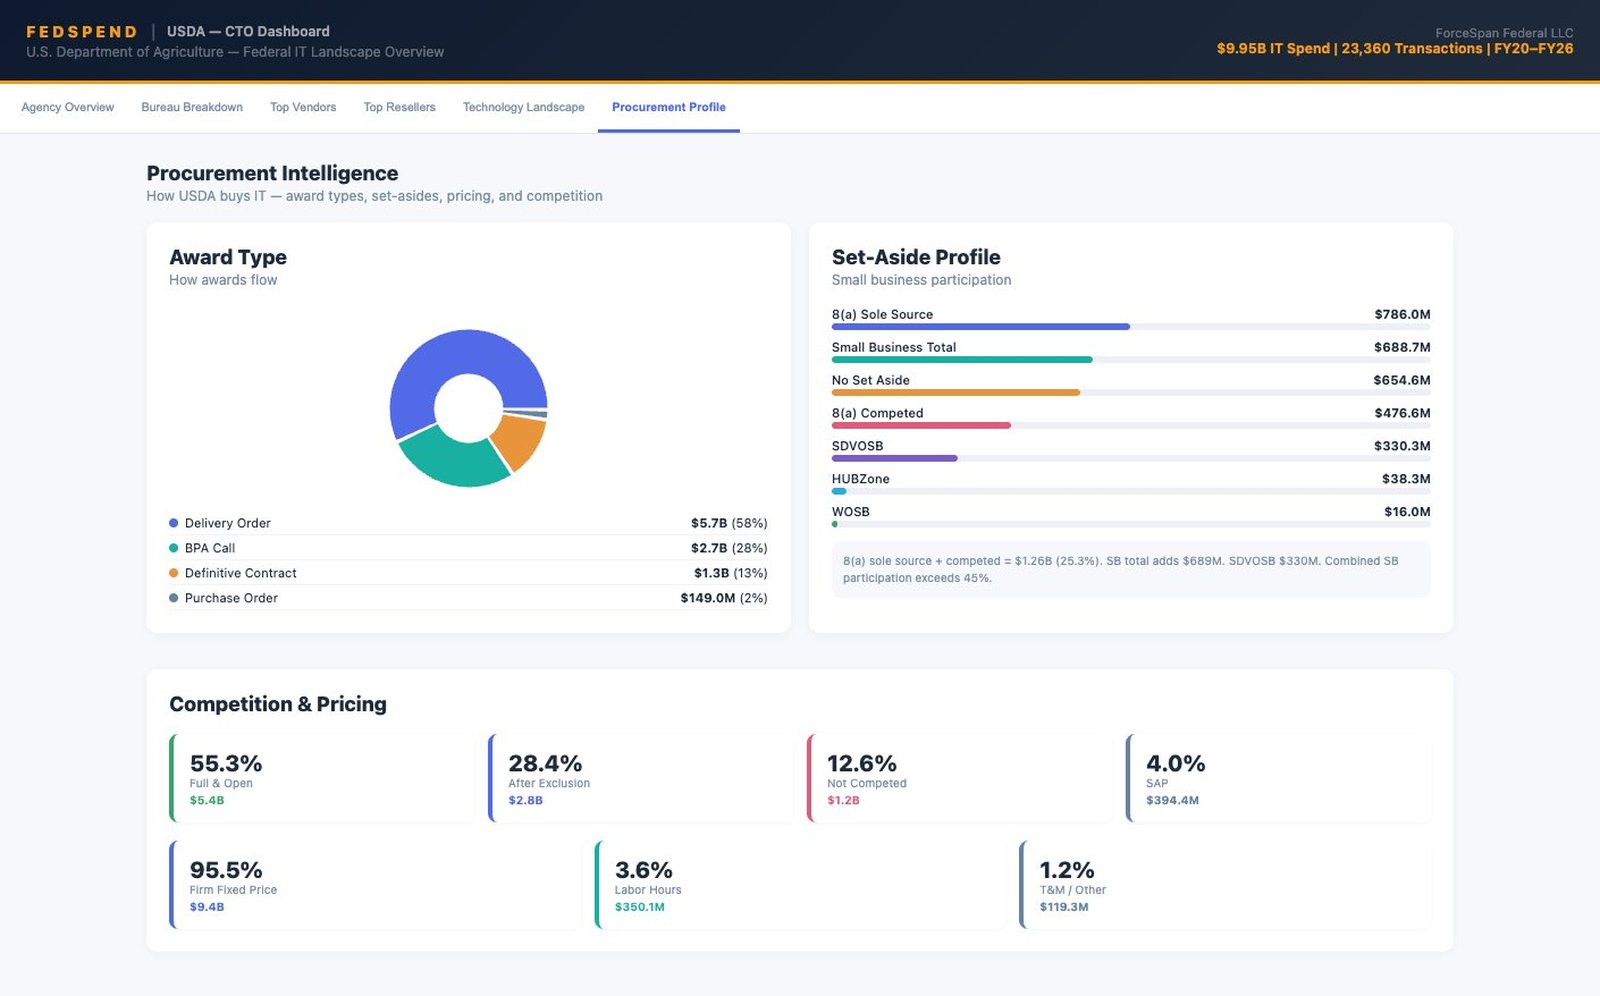
The full federal IT picture for a target agency. Bureau-level end-user attribution, vendor categorization, channel maps, and procurement intelligence — built for anyone selling broadly into a federal agency.

01
Bureau Breakdown

End-user attribution, not just funding agency.

Forest Service isn’t just “Forest Service” — it’s 4,500+ locations doing wildfire IT. We enrich every bureau line with operational context so you understand who actually uses the technology.

Bureau IT Landscape report showing USDA sub-agencies with operational context and IT spend
02
Technology Vendor Landscape

Every OEM, classified and trended.

Top technology vendors classified by category — Enterprise Apps, Cybersecurity, Cloud, Networking — with FY trend bars and Key Signals callouts. “Cloud surged 23× in 3 years.” “ServiceNow growing faster than Salesforce.” That’s enrichment, not raw data.

Technology Categories and Top Technology Vendors panels with FY trend bars and Key Signals
03
Procurement Intelligence

How an agency actually buys.

Award type mix, set-aside profile, competition rates, and pricing structure. Anyone competing for a federal contract needs to know: 55% of USDA IT goes Full & Open, 95% Firm Fixed Price, 8(a) sole source clears $786M alone. Strategy starts here.

Procurement Intelligence panel showing award type breakdown, set-aside profile, and competition pricing
Take the agency landscape. Refocus it around your product.
Competitive Reports

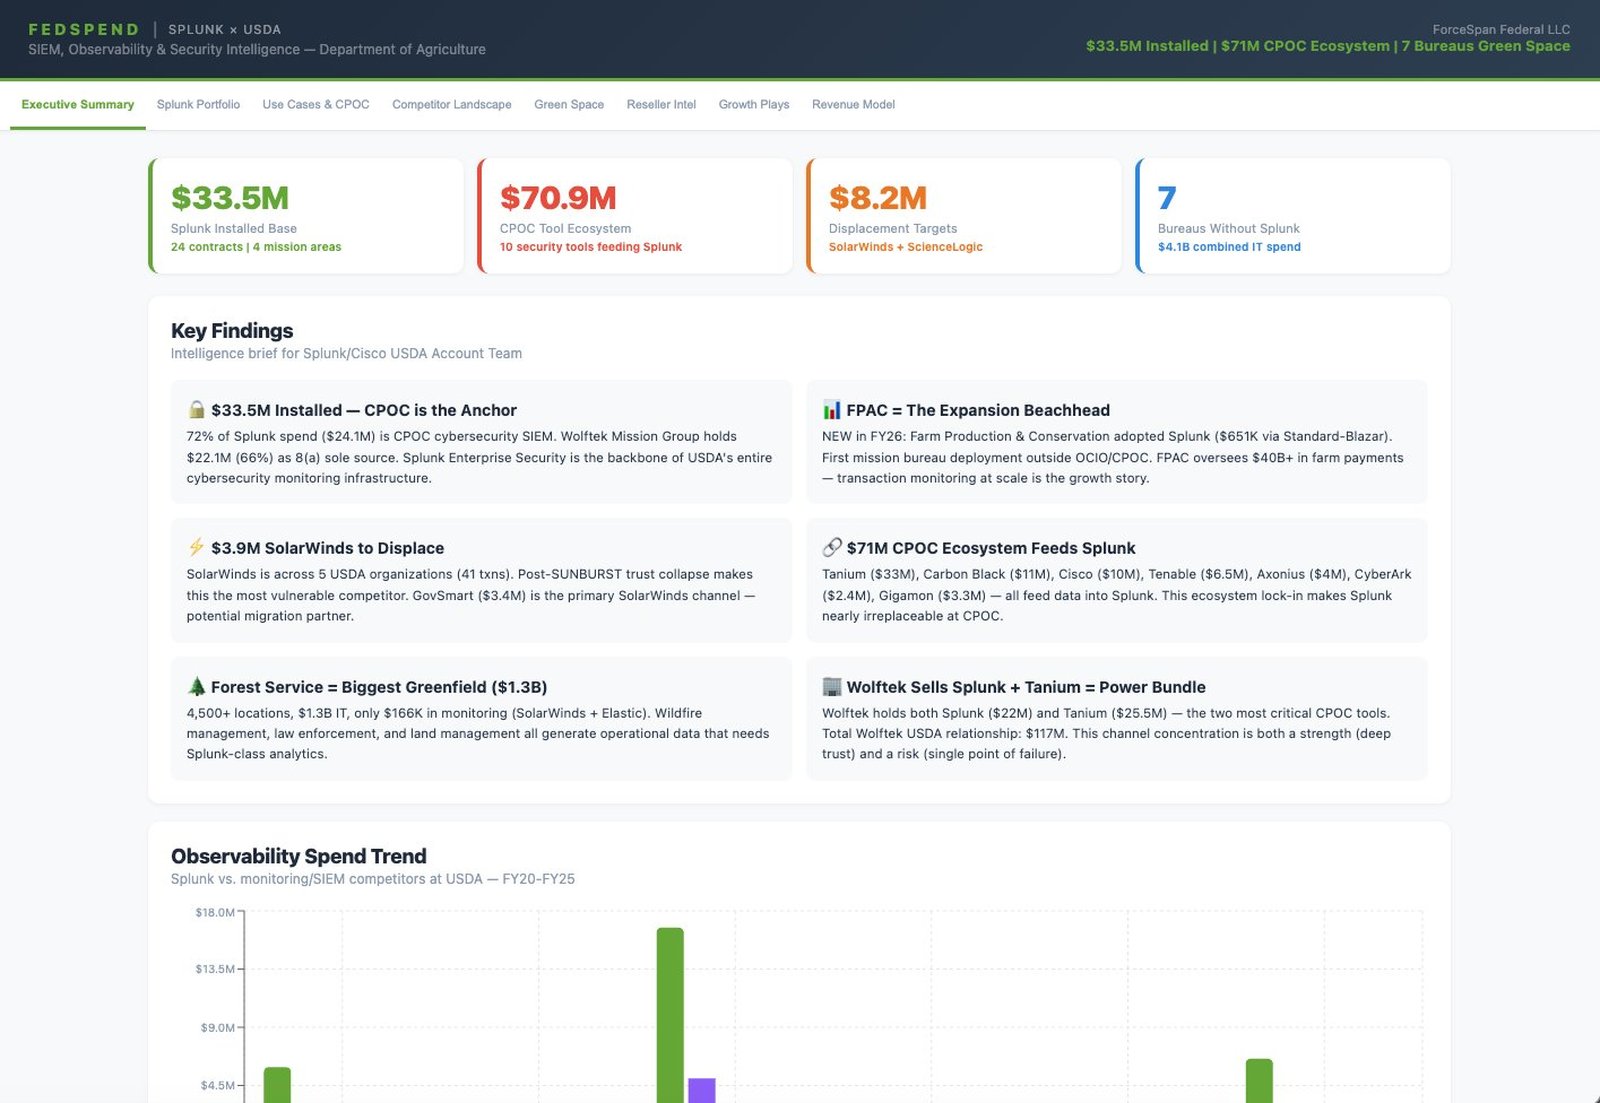
The vendor × agency play.

Take the agency landscape and refocus it around your product. Installed base, ecosystem lock-in, displacement targets, green space — paired with prioritized growth plays sized in dollars and tied to specific contract expirations.

04
Executive Summary

The brief that opens every conversation.

Splunk × USDA at a glance: $33.5M installed, $71M ecosystem feeding into Splunk, 7 bureaus of green space worth $4.1B in IT spend. Plus the Key Findings that frame the whole report — what’s the anchor, what’s the beachhead, who’s the displacement target.

Splunk x USDA executive summary report with installed base, ecosystem, displacement targets, and green space metrics
05
Growth Plays

Eight prioritized actions, sized.

“Defend & Expand CPOC Enterprise: $22.1M → $30M+, license expires Sep 2025.” “Capture Forest Service: $1–3M potential, SolarWinds declining post-SUNBURST, Thundercat is the channel.” Each play tagged DEFEND/GROW/CONQUER, sized in dollars, tied to a specific contract or deal moment.

Eight growth plays report with defend, grow, and conquer plays tied to specific contracts and revenue targets
Intelligence priced for
the deal it helps you win.
Intelligence
$79/month
For the federal sales rep who needs the data and the agency landscape.
  • Full Award Data platform access
  • 2 agencies covered
  • Agency Overview report
  • Top Resellers report
  • CSV export
  • Email support
Get Started
Team
Custom
Strategy tier built for sales teams — multi-seat, shared workspace, admin controls.
  • Everything in Strategy, scaled for teams:
  • Multiple seats with centralized billing
  • Shared workspace and saved views
  • Admin controls and user management
  • SSO (when ready)
  • Dedicated success manager
  • Volume pricing
  • Quarterly business review
Contact Sales
Data Sources
USAspending.gov SAM.gov SEWP FPDS

Your competitors already know
what you’re selling.

Do you know what they’re selling? FedSpend gives you the intelligence to win before the RFQ drops.

Request a Sample Report